The economies of income tax free states

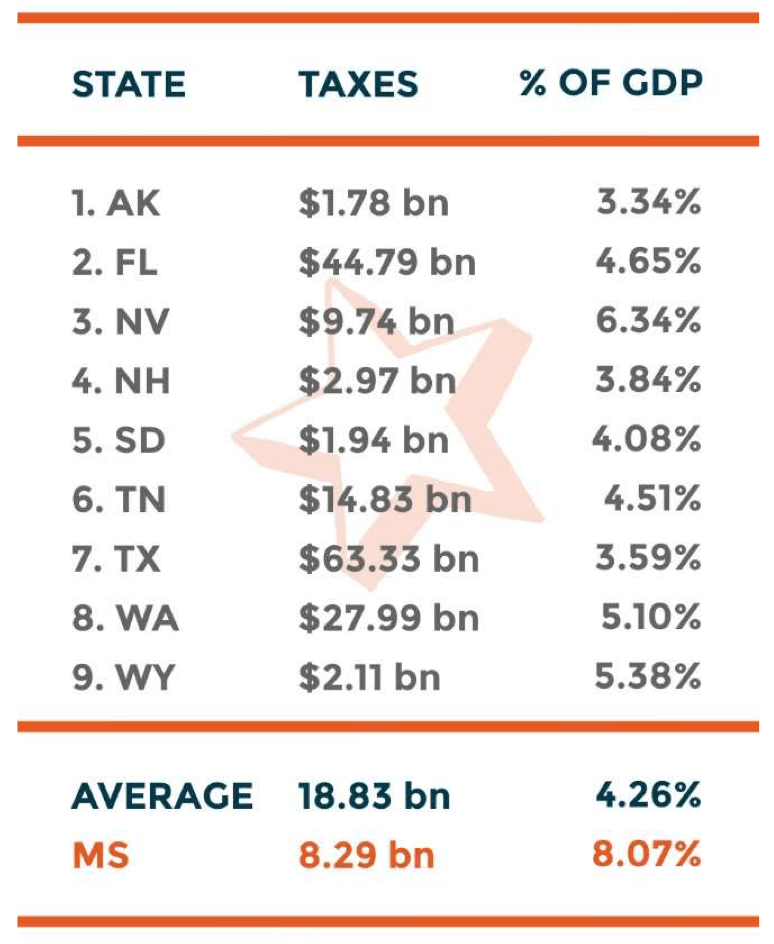
The nine income tax free states have a tax burden that is roughly half that of Mississippi’s.
The nine-income tax free states average a tax burden of 4.26% of their overall economies. Mississippi’s is over 8%.
How is it possible that states with an average tax burden that is nearly half that of Mississippi have experienced revenue growth to state coffers that far exceeds Mississippi’s experience?
The answer, to put it plainly, is both economic and population growth that far exceeds Mississippi’s.
Median household income
Median household income is essentially the midpoint in the household income spectrum. The below chart compares the nine- income tax free states with Mississippi, using statistics for real median household income (adjusted for inflation) from 2019. The percentage of growth is a measure of the same statistic from 2010-2019.
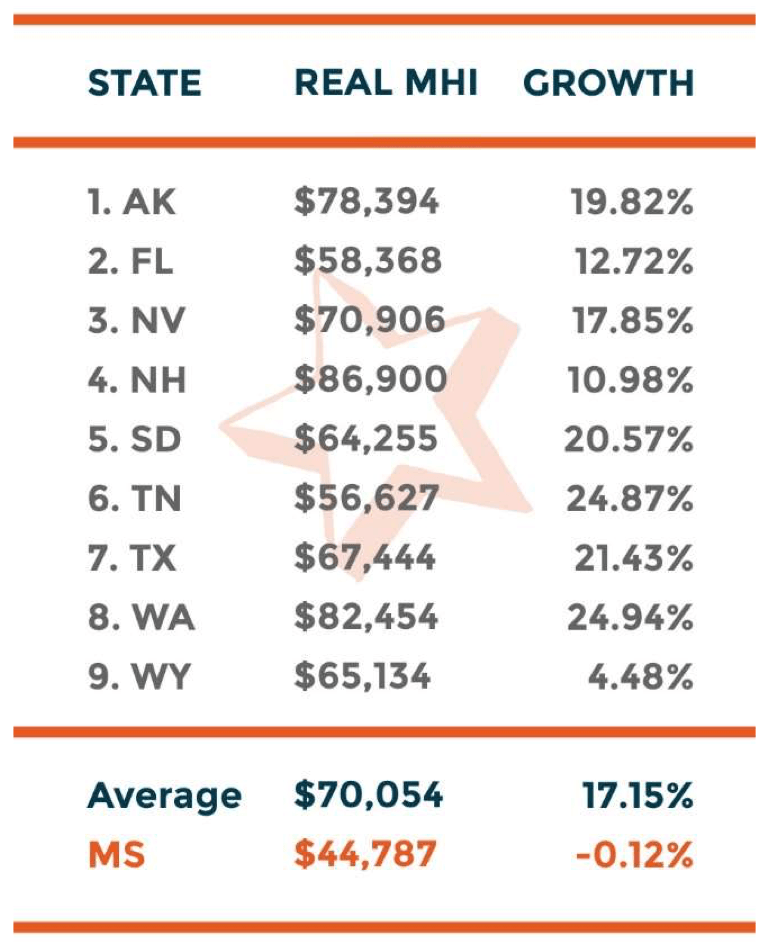
Obviously, with Mississippi in last place for median household income, all nine-income tax free states outperform, with the average median household income in those states coming in 56 percent above Mississippi’s number. The growth rate in real median household income over the last decade is also orders of magnitude above Mississippi’s negative rate.
Gross domestic product
The below chart compares the real gross domestic product (adjusted for inflation) of the nine-income tax free states with Mississippi. The second column is taken from 2019. The third column’s percentage of growth is a measure of the same statistic between 2010-2019.
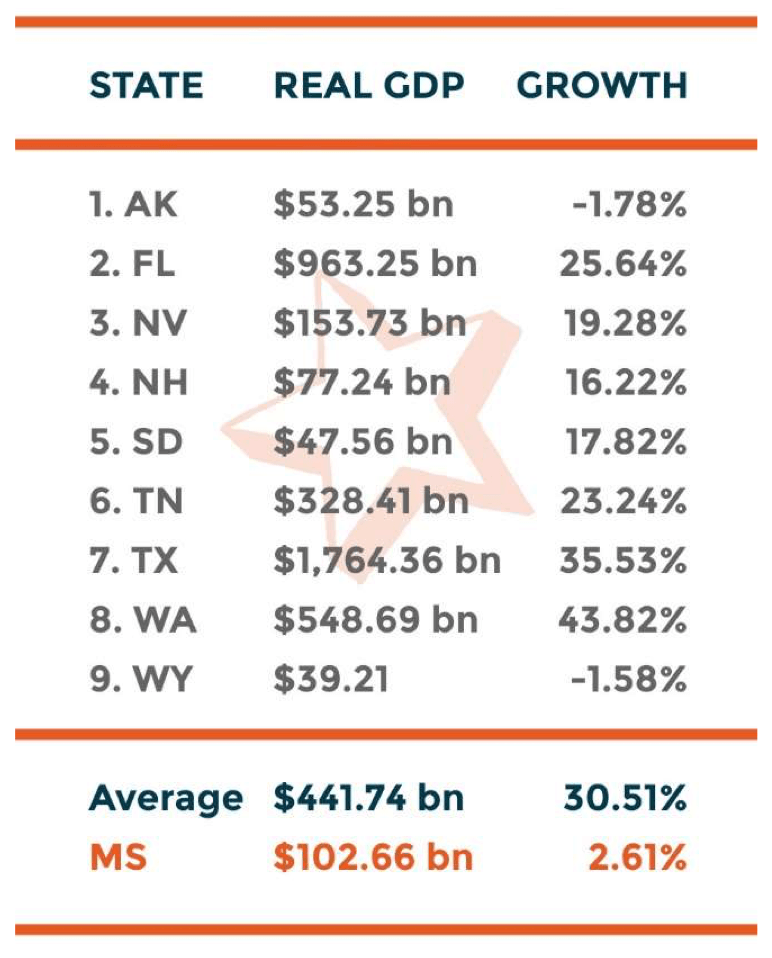
A review of the real gross domestic product comparison between the nine-income tax free states and Mississippi reveals that four of those states have economies that are much smaller than Mississippi’s, and five have economies that are much larger than Mississippi’s.
These economies have grown at a rate that far exceeds Mississippi’s real GDP growth, a full order of magnitude greater. Notably, Alaska and Wyoming, which rely on the oil industry for much of their economy, are outliers.
Labor force participation
The below chart reflects the labor force participation rates in each of the nine-income tax free states as compared with Mississippi’s labor force participation rate as of December 2020.
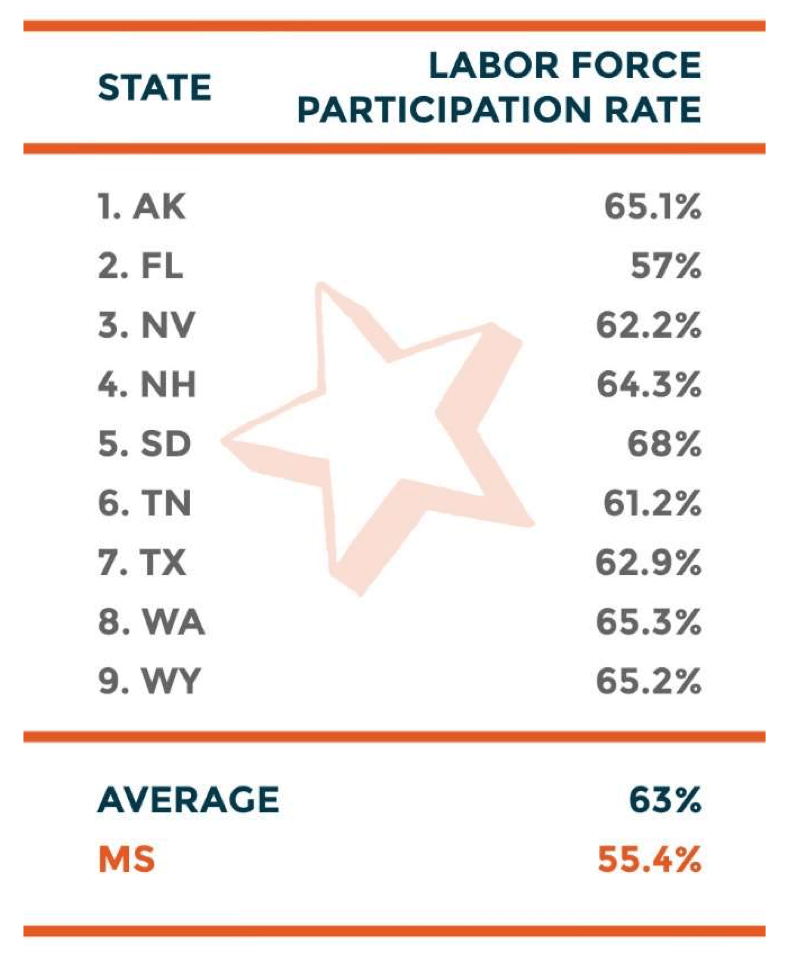
To put into perspective the gap between Mississippi and these states, every percentage point represents nearly 23,000 Mississippi workers, such that if Mississippi were to raise its labor force participation rate in line with the average of these states it would mean approximately 170,000 new Mississippi workers would come off the sideline.
Population growth
The next chart reflects population growth in each of the nine-income tax free states as compared with Mississippi’s population growth during the past decade, according to official Census data.
| State | Population change |
|---|---|
| Alaska | 3.3% |
| Florida | 14.6% |
| Mississippi | -0.2% |
| Nevada | 15% |
| New Hampshire | 4.6% |
| South Dakota | 8.9% |
| Tennessee | 8.9% |
| Texas | 15.9% |
| Washington | 14.6% |
| Wyoming | 2.3% |
| U.S. Average | 7.4% |
The point of making these comparisons, both on revenue and economic performance, is to demonstrate that states can maintain sufficient revenue to fund the core functions of government and excel at providing a good life to their citizens without income taxes.

Brett Kittredge
Brett Kittredge is the Vice President of Marketing and Communications for Empower Mississippi. In his role he oversees marketing and communications strategies for a portfolio of initiatives that includes education, expanding work opportunities and justice.