Mississippi Rolled Like the Tide in K-12 Gains Last Decade – What Comes Next?

Mississippi students had a remarkable decade of academic progress between 2009 and 2019, but the keyword in this sentence is “had.”
The COVID-19 pandemic has essentially reset American schools with students who will return to class with varying levels of learning deficiencies. The charts below show just how much Mississippi gained during the decade between 2009 and 2019, and what remained to be done before the reset. Mississippi has a record of K-12 success to build upon but must continue to boldly give families the tools they need to equip students with the knowledge, skills, and habits necessary to flourish and exercise responsible citizenship.
The National Assessment of Educational Progress (NAEP) – also known as “the Nation’s Report Card”– gives representative samples of students in all 50 states’ academic exams. Unlike state exams, these tests are low-stakes (no rankings of schools) and highly secure. The NAEP is highly respected among education researchers and scholars.
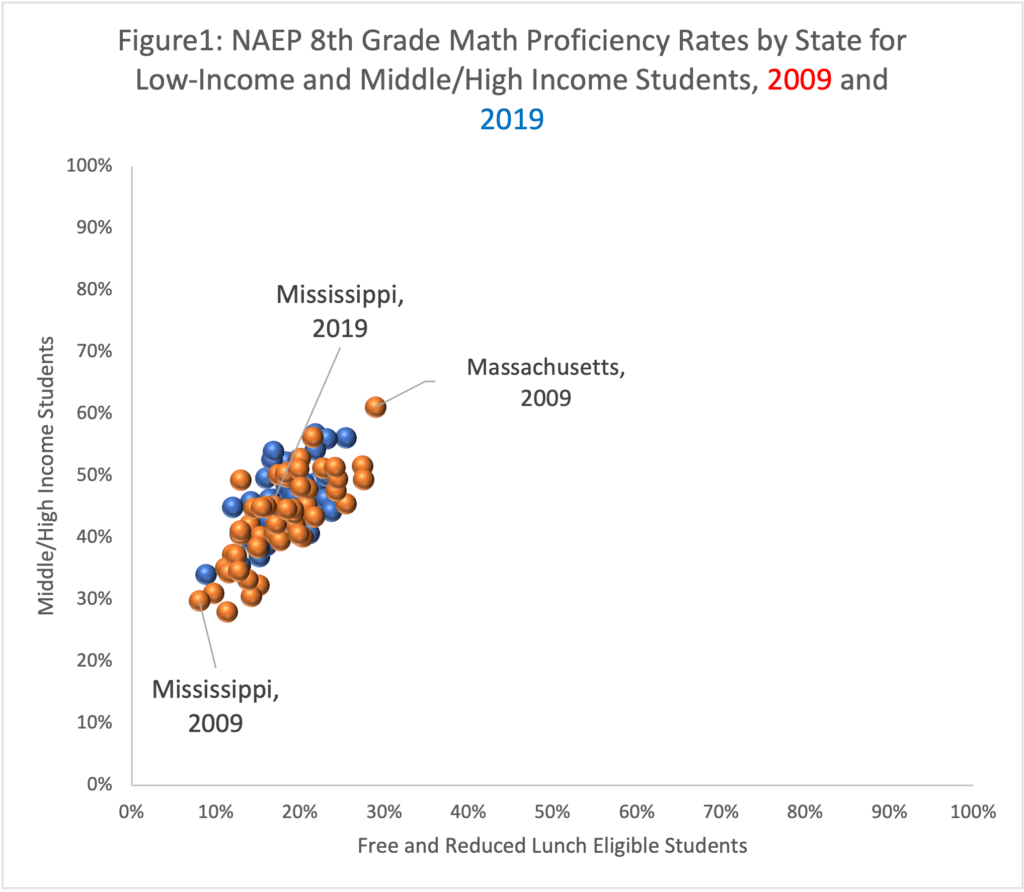
The below chart is a scatterplot by state for low-income students across the horizon, middle and high-income students vertically. All 50 states are plotted by proficiency rates on the 8th-grade math exam given in 2009 (red dots) and then again in 2019 (blue dots).

The Mississippi student body of 2009 ranked near the bottom among both low-income students (8 percent proficient) and middle/high-income students (30 percent proficient). In 2019 those percentages had moved to 17 percent Proficient among free and reduced lunch eligible Mississippi students and 46 percent for middle/high-income students. This decade moved Mississippi students from the bottom on the 8th-grade math barrel to a middle-performing state.
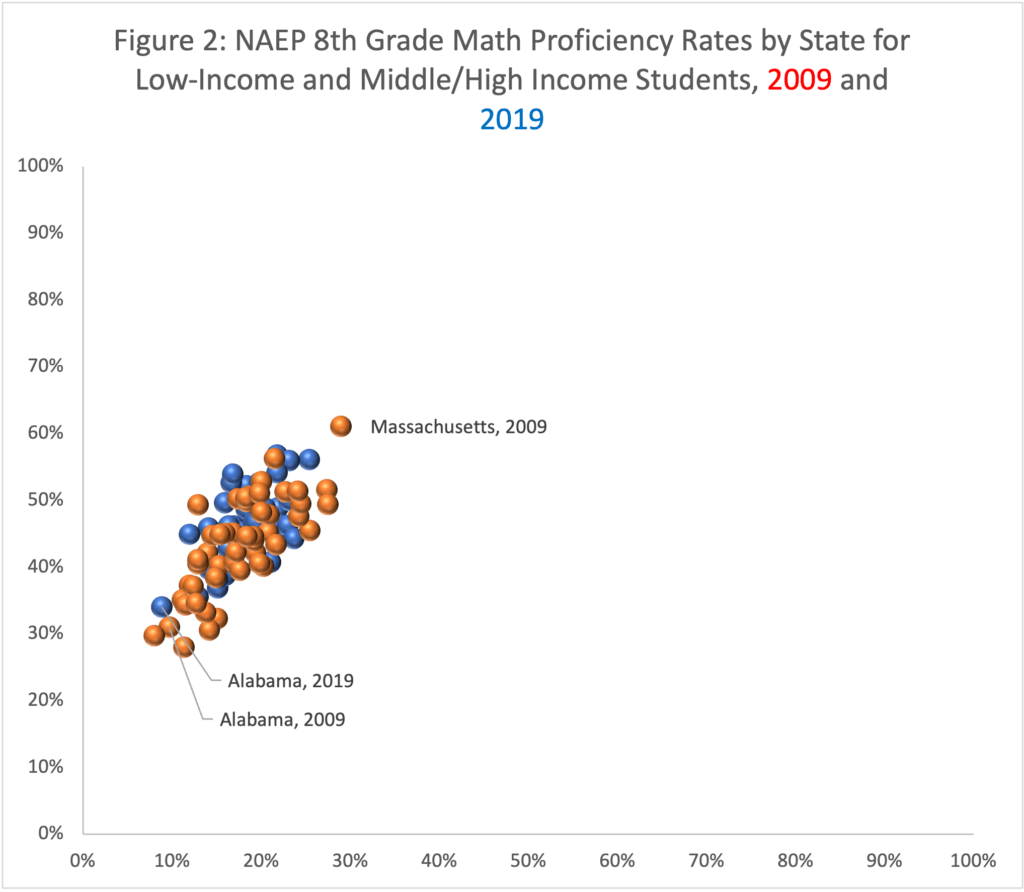
Naysayers will assert a “those scores had nowhere to go but up” theory when states adopt successful reforms. You should not however be deceived: there is nothing inevitable about academic improvement. To illustrate this point, the below chart is identical to the one above, but with Alabama highlighted rather than Mississippi.

Alabama has a lot to teach the rest of the country when it comes to college football. Mississippi however was the Nick Saban-era Crimson Tide of K-12 improvement. NAEP gives six different academic exams – 4th and 8th-grade Mathematics, Reading, and Science. Only Mississippi students saw statistically significant gains on all six exams between 2009 and 2019. We should regard this as of the most vital importance, as it demonstrates that it is not only possible to improve academic outcomes for school systems with high poverty, it has actually been done.
Both charts note the position of Massachusetts students in 2009-purposefully. An academic team including scholars from Harvard and Stanford linked 2009 NAEP scores to international exams. In this study, Massachusetts had the highest American scores and when compared to international systems performed well – just behind Switzerland and just ahead of Japan and Canada. Now, look at Figure 1 again – if Mississippi improved half as much between 2019 and 2029 as it did between 2009 and 2019, Mississippi would be in the neighborhood of Massachusetts and thus Canada and Japan.
This will be much easier said than done, especially with the need to recover from the massive COVID-19 disruption. Future posts will address the possibility that the Mississippi academic surge has gathered the low-hanging fruit of reform. For now simply note that if the better performing European and Asian school systems were included in the above figures, they would be in the neighborhood of the 2009 Massachusetts rather than at the far right top corner.
A globally competitive K-12 system is not an unobtainable pipe dream. While Massachusetts has a reputation for high-performing schools, it also a very wealthy state. Canada and Japan both have per capita income figures much more similar to Mississippi than to Massachusetts. Accordingly, both Canada and Japan spend less per pupil than Massachusetts.
If Estonia and Slovenia can beat the United States average on international achievement exams, I can’t see any reason why Mississippi can’t do the same. You’ve already demonstrated that demographics are not destiny in one decade- why not repeat the performance?
In future posts, I’ll explore the actions Mississippi took to lead the nation in gains during the previous decade, and why they are not necessarily the same reforms needed to ensure progress in the next decade. For now, let’s acknowledge the very solid foundation of improvement upon which Mississippi has to build upon-well done!
